

News release: Post flight analysis
Here are the graphs of the two important flights we did on the Aconcagua expedition sourced from my Volkslogger flight recorder.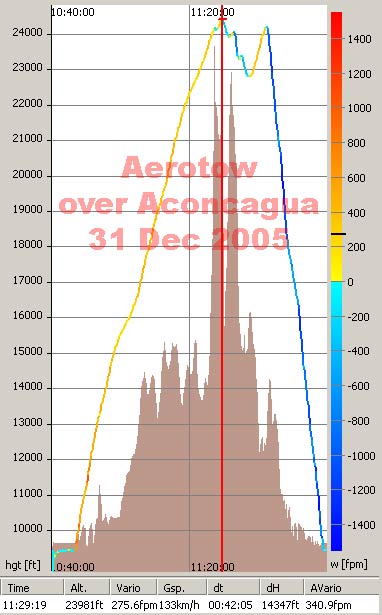
Above is the graph of the actual tow over Aconcagua on 31 Dec 2005. The brown area is terrain. What is most interesting about this is the rate of climb which is in the region of 3-400 fpm all the way; very good. The maximum height achieved was 23,981 ft more or less over the summit, so 1100 ft or so above summit height.
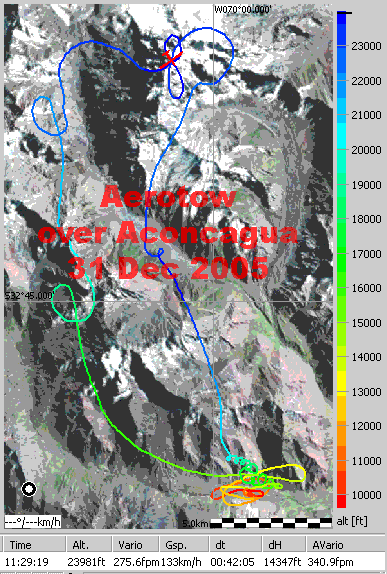
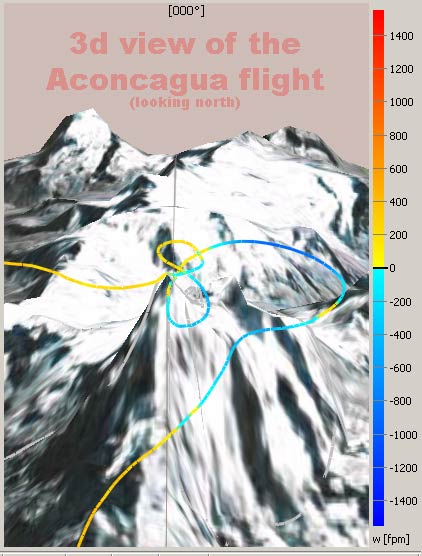
Above are a satellite map and 3d view showing my track over Aconcagua. The climbing phase is to the left hand side, always to the windward of the mountain. The two circles were to gain height before crossing ridges. We circled around the summit twice before Angelo released. With reference to the top graph it is interesting to see the large area of sink I encountered in the big loop to the leeward of the mountain (I was at full power) and then started climbing well again as soon as I got back to a reasonable distance from the ridge. I stayed high more or less until back over our airfield until I started circling to lose height.
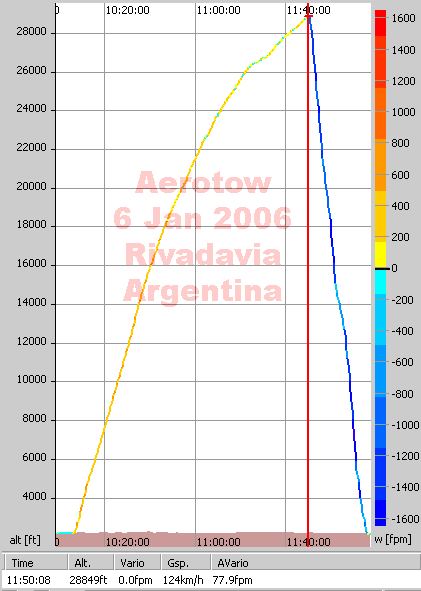
Above is the graph showing our tow of 6 Jan. This is probably the highest actual aerotow I've done thus far, reaching 28,849 ft. Climb rate up to 26,000ft was good, an average of around 300 fpm but above that it suddenly dropped to a rather disappointing 75 fpm. Whether this was an engine performance issue, or we were in fact in descending wave I don't know.
Times shown are UTC, all altitudes are shown against the standard atmosphere of 1014.2 Mb so the reality may have been a little different on the day depending on the local pressure.
Short Video of the summit flight.
Graphics are screen shots of the splendid SeeYou v 3.31


